Proactive and reactive network monitoring in a single package
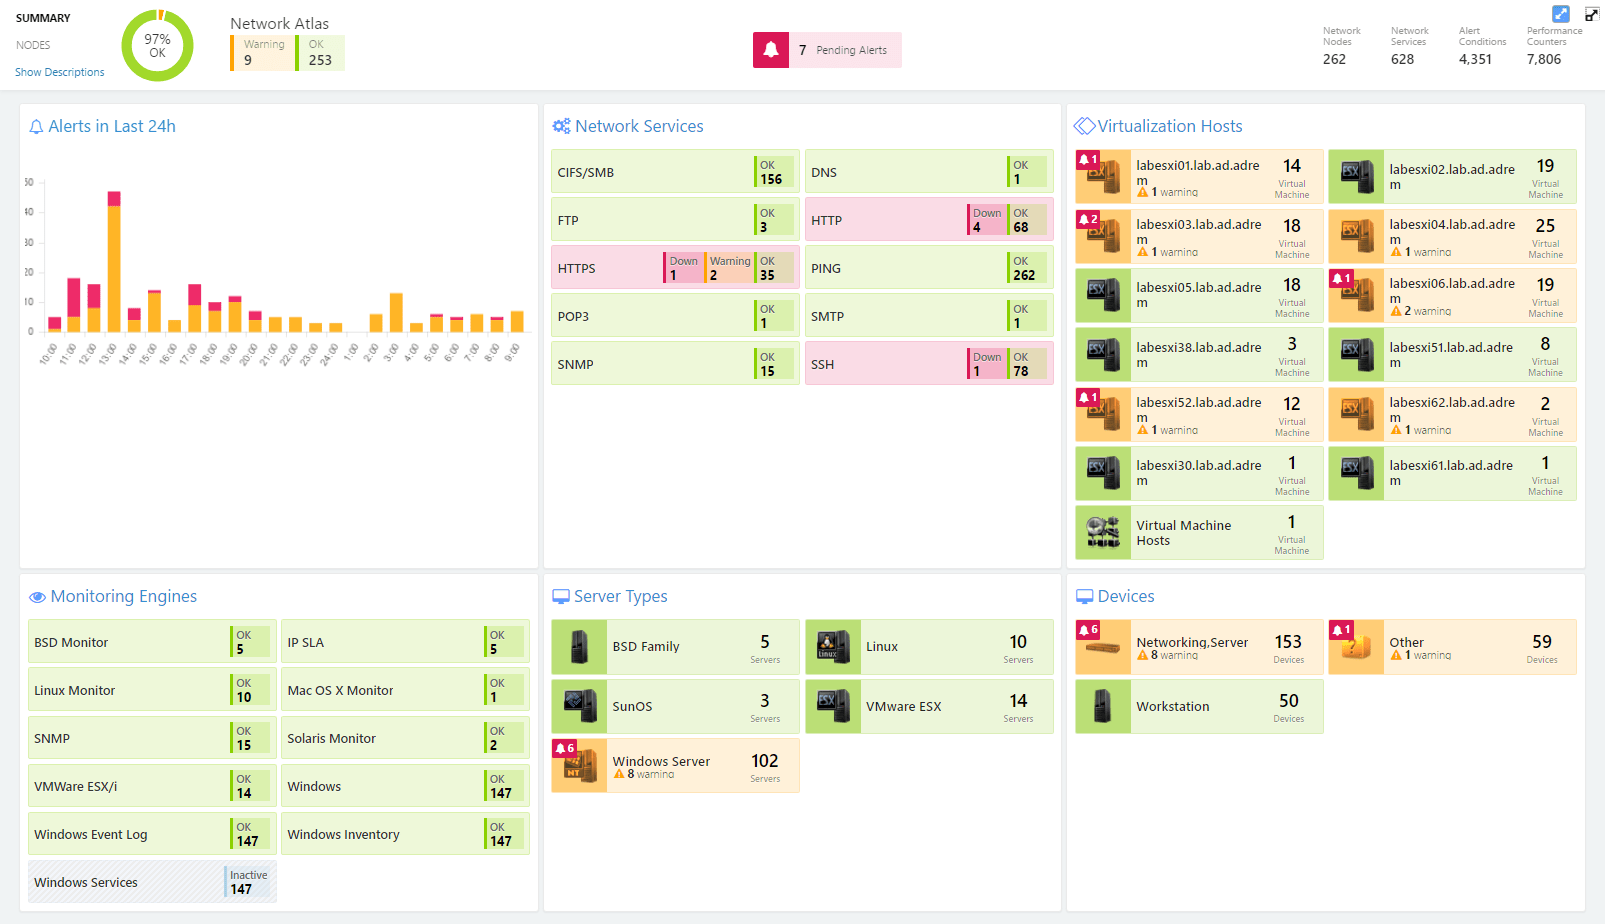
NetCrunch monitors over 600 targets right out of the box – Network devices, servers, virtualization, cloud services, IoT, configuration, sensors, etc
Without installing any agents, NetCrunch can monitor your entire network out of the box. It is an affordable Network Monitoring solution with a simple node-based pricing structure and perpetual license (one-time cost). It offers powerful features to systems administrators and network professionals to ensure visibility into their networks and maintain network uptime. It also provides Bandwidth monitoring for your entire network.
NetCrunch Network Monitoring solution has 650+ Monitoring Packs, Services, and Sensors that are ready-to-use sets of monitoring settings, customizable sensors, and service monitors for monitoring devices and applications. It provides 8,700+ Pre-compiled SNMP MIB modules that collect and compiles thousands of MIB modules from many vendors. 500+ vendors are supported out of the box – it supports many hardware vendors such as Cisco, HP, Dell, IBM, Nortel, and Juniper.
It monitors network services, SNMP devices without agents, Windows applications, as well as Windows, Linux, NetWare, BSD, and Mac OS X systems. It also centralizes fault management by collecting data and alerting on events from sources like Windows Event Log, Syslog, and SNMP traps. It shows dynamic graphic views of both physical and logical network topology.
Monitor devices, configuration, hardware, network bandwidth, traffic, service uptime, virtualization, and much more. Beside monitoring computers and networking devices, NetCrunch monitors undersee scientific equipment, factories, traffic lights, video recorders, broadcasting equipment, etc. It includes protocol checks, windows, applications, web/cloud, hardware, network, email, data & logs, folders & files, database, security, WBEM, operating systems, configurations, AWS, Azure, Google, Microsoft, Zoom, and events.
NetCrunch for Network Infrastructure Devices
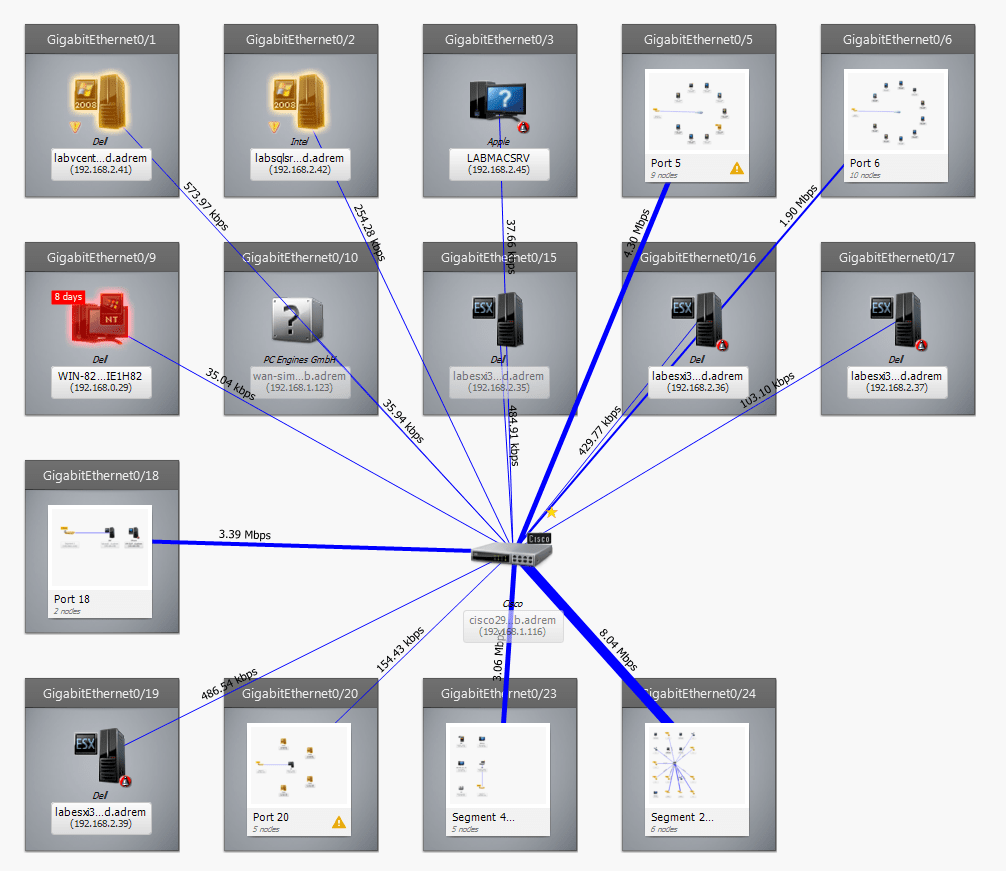
Monitor network services, switches, routers, bandwidth and traffic flow. Easily monitor up/down status, files, web, IP SLA and more. Use built-in Netflow/sFlow analyzer with Cisco NBAR support to analyze traffic structure. View switch port mapping and layer 2 maps. Full SNMP support with a MIB compiler and 3500+ MIBs included.
It helps you control the performance and availability of network services (Ping, HTTP, SSH, FTP, etc.), watches connections and also reflects them automatically on various graphical network views, like layer 2 segments maps.
Servers, Applications, and Virtualization
Monitor Windows, VMware ESXi, Linux, Mac OS X, Solaris and BSD servers and workstations. Monitor virtual machines, files, folders, web pages. Run custom scripts or simply send performance or status data over HTTP using a simple REST API. Manage status, logs and performance of systems.
It monitors (without agents) operating systems such as: Windows, Mac OS X, Solaris, Linux and BSD. It fully supports ESXi and monitoring web, text logs and more.
Alerting and Event Management
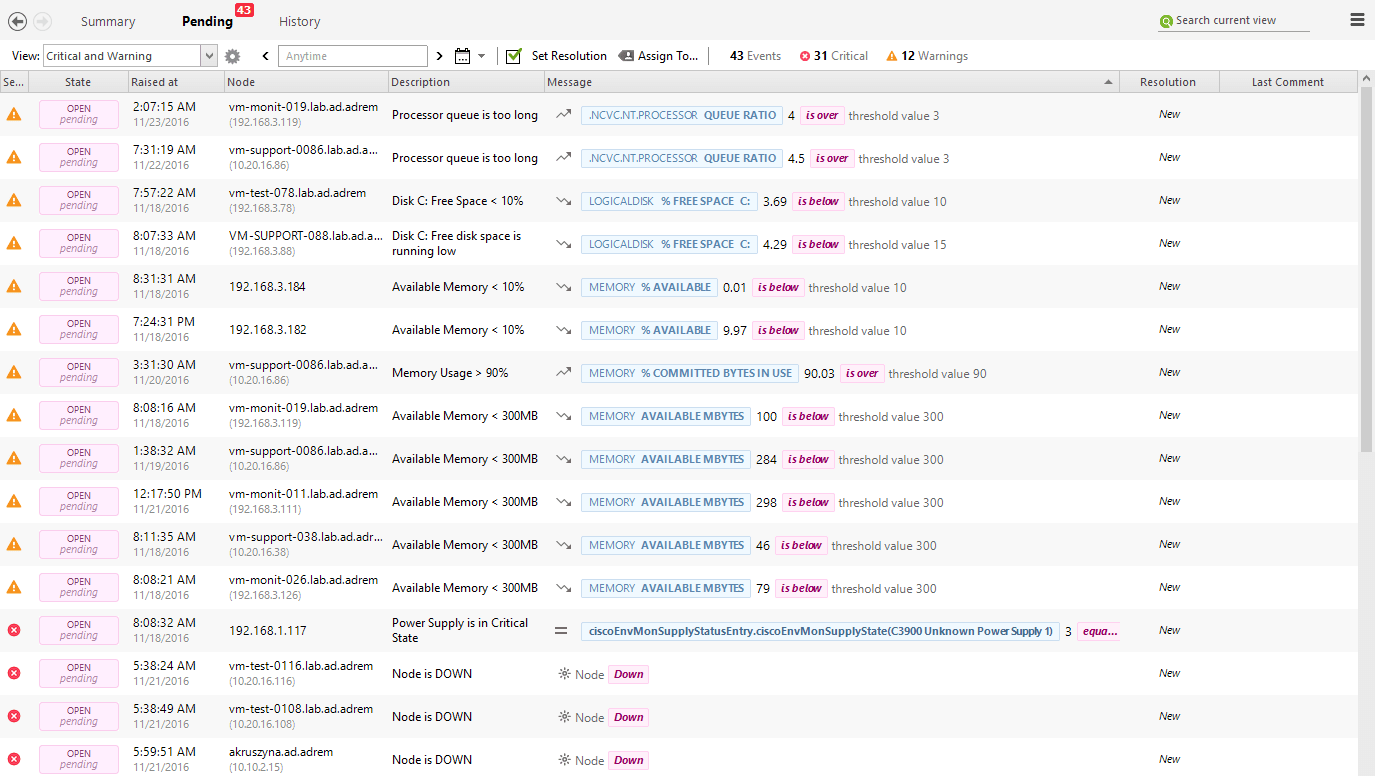
Receive alerts from SNMP traps, Syslog messages, or web messages. Collect Windows Event Log and monitor text logs using parsing expressions. Use advanced alert correlation and conditional alerts. Let it trigger corrective actions including remote execution. Set various triggers on performance parameters.
NetCrunch can act as a log server for external event sources. It stores them in the Event Log database and performs defined alert actions (i.e. notifications) in response to alerts.
Comprehensive Monitoring
You don’t need multiple products to monitor and manage multiple devices. NetCrunch Network Monitoring tool has comprehensive support for SNMP up to and including SNMPv3. With thousands of pre-compiled MIBs and MIB compiler, if you have lesser-known or custom-made devices, NetCrunch comes with limitless capabilities. OpenManager and External Events let you feed data into it, and react to it however you’d like. Via API, Syslog, traps, you can monitor anything that can send info to it.
Events:- Information about some occurrences generated by NetCrunch or external sources such as Windows Event Log, SYSLOG, or SNMP trap.
Performance Counters (Metrics):– Numerical values (64-bit integer or floating-point)
Status: – The status of various objects such as nodes, services, monitoring engines, etc.
Network Infrastructure (SNMP):- NetCrunch can be used just for network monitoring, where we mainly pay attention to SNMP devices, such as printers, switches, routers, cameras, and others. It supports SNMP v1/v2c/v3, including encryption and authentication.
Connectivity & Response Monitoring:- NetCrunch monitors the availability of over 65 predefined TCP/UDP network services, including DNS, FTP, HTTP, POP3, SMTP, and more. The program can monitor network service performance measured by the number of packets sent and packets received, response times, and the percentage of packets lost and received.
Node Up/Down Status:- NetCrunch determines node up/down status based upon network service status and other monitors (in case of servers). When a node is down, only the leading service is being monitored. So, a node is considered “down” when no services are responding and is considered “up” when the leading service responds.
DNS Health Monitoring:- DNS is the most important service in a network. Without it, nothing works at all. Therefore, monitoring the DNS service in order to check its availability is an obvious task for a monitoring system. But availability monitoring only checks if the service is responding and what’s its response time.
On top of simple availability monitoring, it allows you to verify DNS responses to given queries, which in turn allows you to discover unexpected (unauthorized) DNS changes.
Switch and Router Monitoring:- It supports various aspects of switch and router monitoring, including the status of network interfaces and bandwidth monitoring. It allows monitoring traffic on interfaces, port mapping, and creating Layer 2 graphical maps. NetCrunch allows you to monitor Cisco IP SLA operations. It tracks the status of operations and also performance parameters. This allows you to monitor VOIP jitter and other protocols and parameters.
Vendor-specific Monitoring via SNMP:- SNMP is very ubiquitous, but implementation varies. It contains the MIB compiler which allows you to add vendor-specific MIBs. NetCrunch built-in database contains more than 3500 vendor MIBs already.
Servers and Applications:- It supports agentless monitoring of the major operating systems including Windows, Mac OS X, Linux, BSD, and VMWare ESX/i. Additionally, the Windows system supports the monitoring of applications by monitoring their performance parameters and service status.
Windows Monitoring:- It can monitor Performance Counters, Windows Services, Windows Event Logs, Hardware, and Software Inventory
Monitoring ESX/i:- It supports ESX/i version 5.5 and 6. It connects directly to the ESX servers, so it does not need vSphere to be installed. NetCrunch comes with pre-configured Automatic Monitoring Packs to monitor ESX as soon as the device type is set to ESX.
Web Monitoring (Monitoring Web Pages or Applications):- This includes an advanced Web Page monitor that is able to load and render dynamic web pages containing Javascript as if they were loaded by a browser. It also allows you to check pages requiring a login.
NetCrunch Network Monitoring Packs
NetCrunch is based on modules and you can combine any of them to work together. These products present typical use cases or starting points to configure your Network monitoring solution.
NetCrunch for SNMP Devices:- Monitor any SNMP device including routers, switches, and firewalls. Get all 8700+ pre-compiled MIBs with a MIB compiler and comprehensive alerting features. Supports SNMP v1,2c,3
NetCrunch for Network Infrastructure:- Monitor and map your network infrastructure with SNMP, regardless of your vendor solutions. Easily track bandwidth and traffic through flows (Netflow, NBAR, sFlow, etc.).
NetCrunch Performance Monitor:- Complete package with SNMP, network services monitoring, logs, operating systems, virtualization, SQL databases, WMI, IPMI, Web, Cloud, and much more.
NetCrunch Monitoring Suite:- This is the comprehensive network monitoring suite with all the modules. Scalable system for managing a large number of monitored elements. It scales on a single machine to monitor hundreds of thousands of metrics.
Download Demo
You can download a free 30-day demo version here.


